library(readxl)

data <- read_excel("/home/nils/dev/mscids-notes/fs26/dq/data/HSE.xlsx")

boxplot(wtval ~ sex, data = data)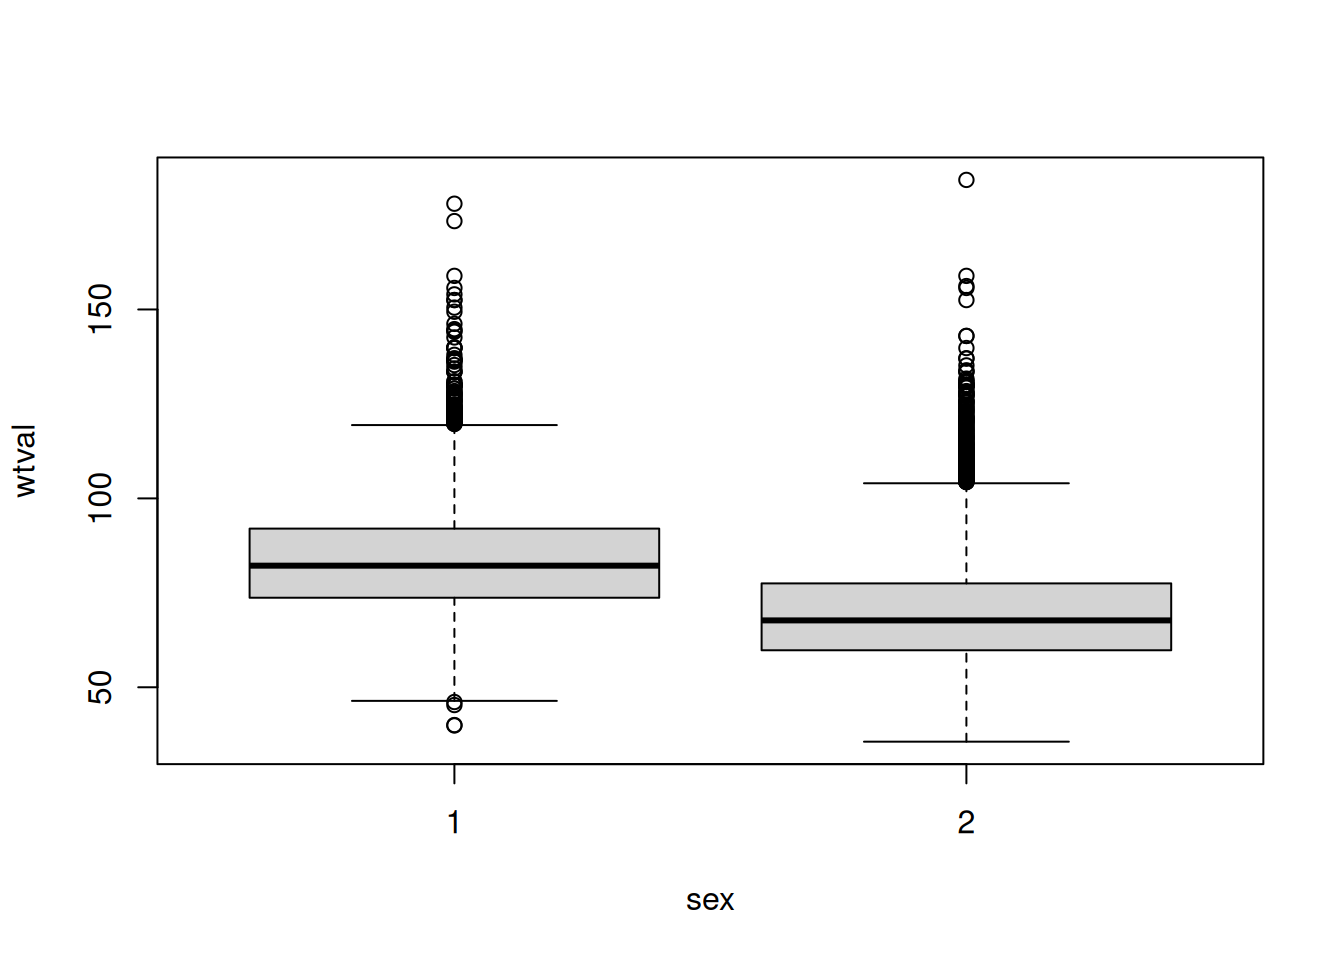
Data quality describes data characteristics at the meta-level. High-quality data provides a reliable and useful structure for information. Conversely, poor data quality can lead to mistrust and inaccurate outcomes.
Note: Personal definition.
Scenario 2: E-Commerce – Inventory Management
Incomplete data can lead to a misunderstanding of consumer behavior and purchasing patterns. Without a full picture, businesses may fail to identify emerging trends or customer needs.
Inaccurate data can result in supply chain bottlenecks or an oversupply of products. This leads to either lost sales due to stockouts or increased storage costs due to excess inventory.
A lack of real-time data availability undermines trust in data-driven processes. If stakeholders cannot access information when needed, they may revert to “gut-feeling” decisions, which are prone to error.
To support effective inventory management, data must meet specific quality standards, such as:
Note: The answers are not disjunct.
| id | last_name | first_name | age | department | function | salary | commision_rate |
|---|---|---|---|---|---|---|---|
| 1 | Smith | Bill | 56 | Sales | Head of Sales | 120.000 | 15% |
| 2 | Muller | John | 25 | Social Media | Creative Director | 100.000 | N/A |
| 3 | Grey | Anna | 37 | SEO | Google Expert | 90.000 | N/A |
| 4 | Berger | Lia | 22 | NULL | Freelancer | NULL | |
| 5 | ? | Mike | 46 | Facility | Team Manager | 75.000 | N/A |
| 6 | Doe | Jane | 30 | IT | Dev | N/A | NaN |
last_name of Mike (ID 5). Every person has a last_name, but it is currently missing from the dataset.department of Lia (ID 4). As an external freelancer, she is not part of the internal organizational structure.salary of Jane (ID 6). It is unclear if she is a paid employee or an unpaid volunteer/intern; thus, the existence of the attribute itself is in question.commision_rate for non-sales employees. This metric is only defined for sales roles and is fundamentally inapplicable to other functions.salary of Lia (ID 4). As a freelancer, the field remains empty until a specific hourly-based invoice or contract condition triggers the entry.Using R, generate a boxplot broken down by gender (variable sex). How can the boxplot be interpreted?
library(readxl)
data <- read_excel("/home/nils/dev/mscids-notes/fs26/dq/data/HSE.xlsx")
boxplot(wtval ~ sex, data = data)
We can clearly se a difference between the two classes.
What are the distributions of the following boxplots?