Python inherently offers useful functionalities such as print(), enumerate(), or list.append(). However, our projects often require more specific tools. This is where packages (or libraries) come in. Packages are extensions for Python that provide specialized functions and tools to efficiently solve a variety of problems.
The most frequently used packages include:
numpy: For fast numerical and mathematical computations.
pandas: For the efficient processing of large amounts of structured data (tables).
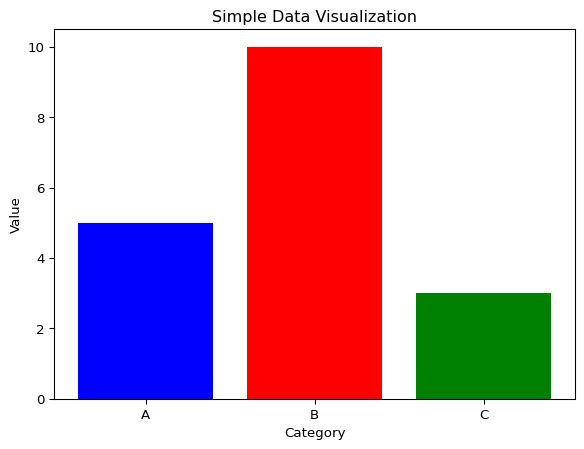
matplotlib: For creating data visualizations and diagrams.
Instead of treating every function of these packages in detail, which would be too extensive, this summary focuses on practical application examples for each presented package.
NumPy
Transposing a matrix means swapping rows and columns. If \(A\) is a matrix, then its transposed matrix \(A^T\) is defined by:
\[
(A^T)_{ij} = A_{ji}
\]
If one were to perform a matrix transposition with pure Python, one would have to manually iterate over rows and columns, leading to comparatively inefficient code.
Depending on the size of the matrix, this process can be very time-consuming. With NumPy, we can use the optimized transposition function to solve this problem quickly and elegantly. NumPy operations are vectorized and run with significantly better performance.
Working with structured data in native Python is possible, but quickly becomes complicated and error-prone with larger data sets. Even simply summarizing a table already requires a considerable amount of code and manual data processing.
sum_col_a =0.0sum_col_b =0.0count =0withopen("data/pandasTable.csv", "r") as f: header = f.readline() for line in f: values = line.strip().split(',') sum_col_a +=float(values[1]) sum_col_b +=float(values[2]) count +=1avg_col_a =0.0avg_col_b =0.0if count >0: avg_col_a = sum_col_a / count avg_col_b = sum_col_b / countprint("Number of Records:", count)print("Column ColA:")print(" Sum:", sum_col_a)print(" Average:", avg_col_a)print("Column ColB:")print(" Sum:", sum_col_b)print(" Average:", avg_col_b)
Number of Records: 5
Column ColA:
  Sum: 82.2
  Average: 16.44
Column ColB:
  Sum: 805.0
  Average: 161.0
With Pandas, we can easily read in structured data and retrieve summary statistics with a single function call, which simplifies data analysis considerably.
import pandas as pddf = pd.read_csv("data/pandasTable.csv")df.describe()
Thousands of packages are available for Python. However, it is advisable to use well-maintained and established standard packages such as numpy, pandas, and matplotlib, as these are regularly updated and have large communities.
If you are looking for a specific tool, PyPI (Python Package Index) is the central hub: PIPY